Inspecting Service Traffic with mirrord dump
In the latest mirrord release, we introduced a new command: mirrord dump. This post covers the why behind it, some common use cases, and a peek under the hood at how it works.
What is mirrord dump?
mirrord dump lets you inspect incoming TCP traffic to a Kubernetes resource, such as a deployment, service, pod, statefulset, etc. directly from your terminal. You can think of it like a built-in tcpdump or Wireshark but for Kubernetes, and scoped just to the resource you care about.
Here’s what it’s output looks like:
➜  mirrord git:(main) ✗ ./target/universal-apple-darwin/debug/mirrord dump -t deployment/ip-visit-counter -p 80
* Listening for traffic... Press Ctrl+C to stop
  ✓ running on latest (3.145.0)!
  ✓ using operator
    ✓ operator version compatible
    ✓ operator license valid
    ✓ user credentials prepared
    ✓ session started
      ✓ connected to the target

## New connection established: Connection ID 0 from 35.191.238.165:55534 to 10.96.1.207:80
## Connection ID 0: 93 bytes
Data: GET /health HTTP/1.1
Host: 10.96.1.207
User-Agent: GoogleHC/1.0
Connection: Keep-alive

## Connection ID 0 closed

## New connection established: Connection ID 1 from 10.96.1.1:35510 to 10.96.1.207:80
## Connection ID 1: 107 bytes
Data: GET /health HTTP/1.1
Host: 10.96.1.207:80
User-Agent: kube-probe/1.32
Accept: */*
Connection: close
In short, it prints every connection, every request, raw and unfiltered, so you can easily see what’s hitting your service.
Why did we build this?
Before we talk about that, I want to start with some honesty - I vibe coded it. I used Cursor and I almost didn’t do any manual modifications other than fixing “junior developer” level mistakes it made.
Most of the technology for implementing mirrord dump was anyways already there. You could already do something similar with:
mirrord exec -t deployment/ip-visit-counter -- nc -k -l 3000
…but that came with its own problems. For one, some nc versions only support a single connection at a time which isn’t ideal.
So instead of duct-taping it every time, we decided to build mirrord dump as a first-class feature. It’s faster to use, more robust, and less hacky.
What can you use it for?
Debugging Incoming Traffic
Sometimes your service is throwing 500s and you have no idea why. Is it the app? The ingress? Some hidden mesh config? Instead of guessing, you can now just run mirrord dump and watch the traffic hit your service.
If you don’t see any traffic? You’ve just ruled out your app. Traffic is probably being dropped before it gets there. If you do see traffic, but it’s malformed or missing headers - congrats, now you have real clues. This is basically like a tcpdump, scoped and filtered to just what you care about.
Onboarding mirrord in Your Organization
When companies start adopting mirrord, one of the first things they want to enable is concurrent usage so that multiple developers can use mirrord in the same shared environment (like a staging cluster) without stepping on each other’s toes.
To do that, you need to filter traffic per developer session. You want each developer to see only their own traffic, not everyone else’s. That’s where traffic filters come in. mirrord lets you filter incoming requests based on headers like user-id, X-Session-ID, tenant-id, etc. so each developer can isolate and mirror just the traffic relevant to them.
But to do this you need to figure out what header to filter by in the first place.
For that you could:
- Read through internal docs (if they exist),
- Dig into 5+ microservice repos to trace what’s being propagated
Now you can just run mirrord dump and see the actual headers flowing between services. For example, if you notice that each request includes a user-id, great, since now you can configure mirrord to mirror only requests with your own user ID, and let your teammates do the same with theirs.
Troubleshooting mirrord Itself
mirrord can have edge cases: maybe the agent fails to inject, maybe it’s not able to load into your target process. When things don’t work, mirrord dump gives you a way to test if traffic mirroring is working independently from the rest of the functionality (like running mirrord exec). If the dump shows traffic coming through, then mirroring works and it’s something else that’s broken.
How does it work?
mirrord dump reuses the same core mechanics of any mirrord session:
- Spawns an agent, either via:
- the mirrord operator (for Teams users), or
- directly via agent pod creation (for OSS users).
- Once the agent is live, it subscribes to traffic on a specific port.
- Under the hood:
- It opens a raw socket inside the Linux network namespace of the target pod (note: Linux namespace, not Kubernetes namespace).
- Any incoming TCP traffic is captured and relayed back to your terminal via the Kube API.
There’s no eBPF, no cluster-wide install, no sidecars! :)
Note: If you’re using the operator,
mirrord dumpworks with workloads that have multiple replicas (something OSS option doesn’t support).
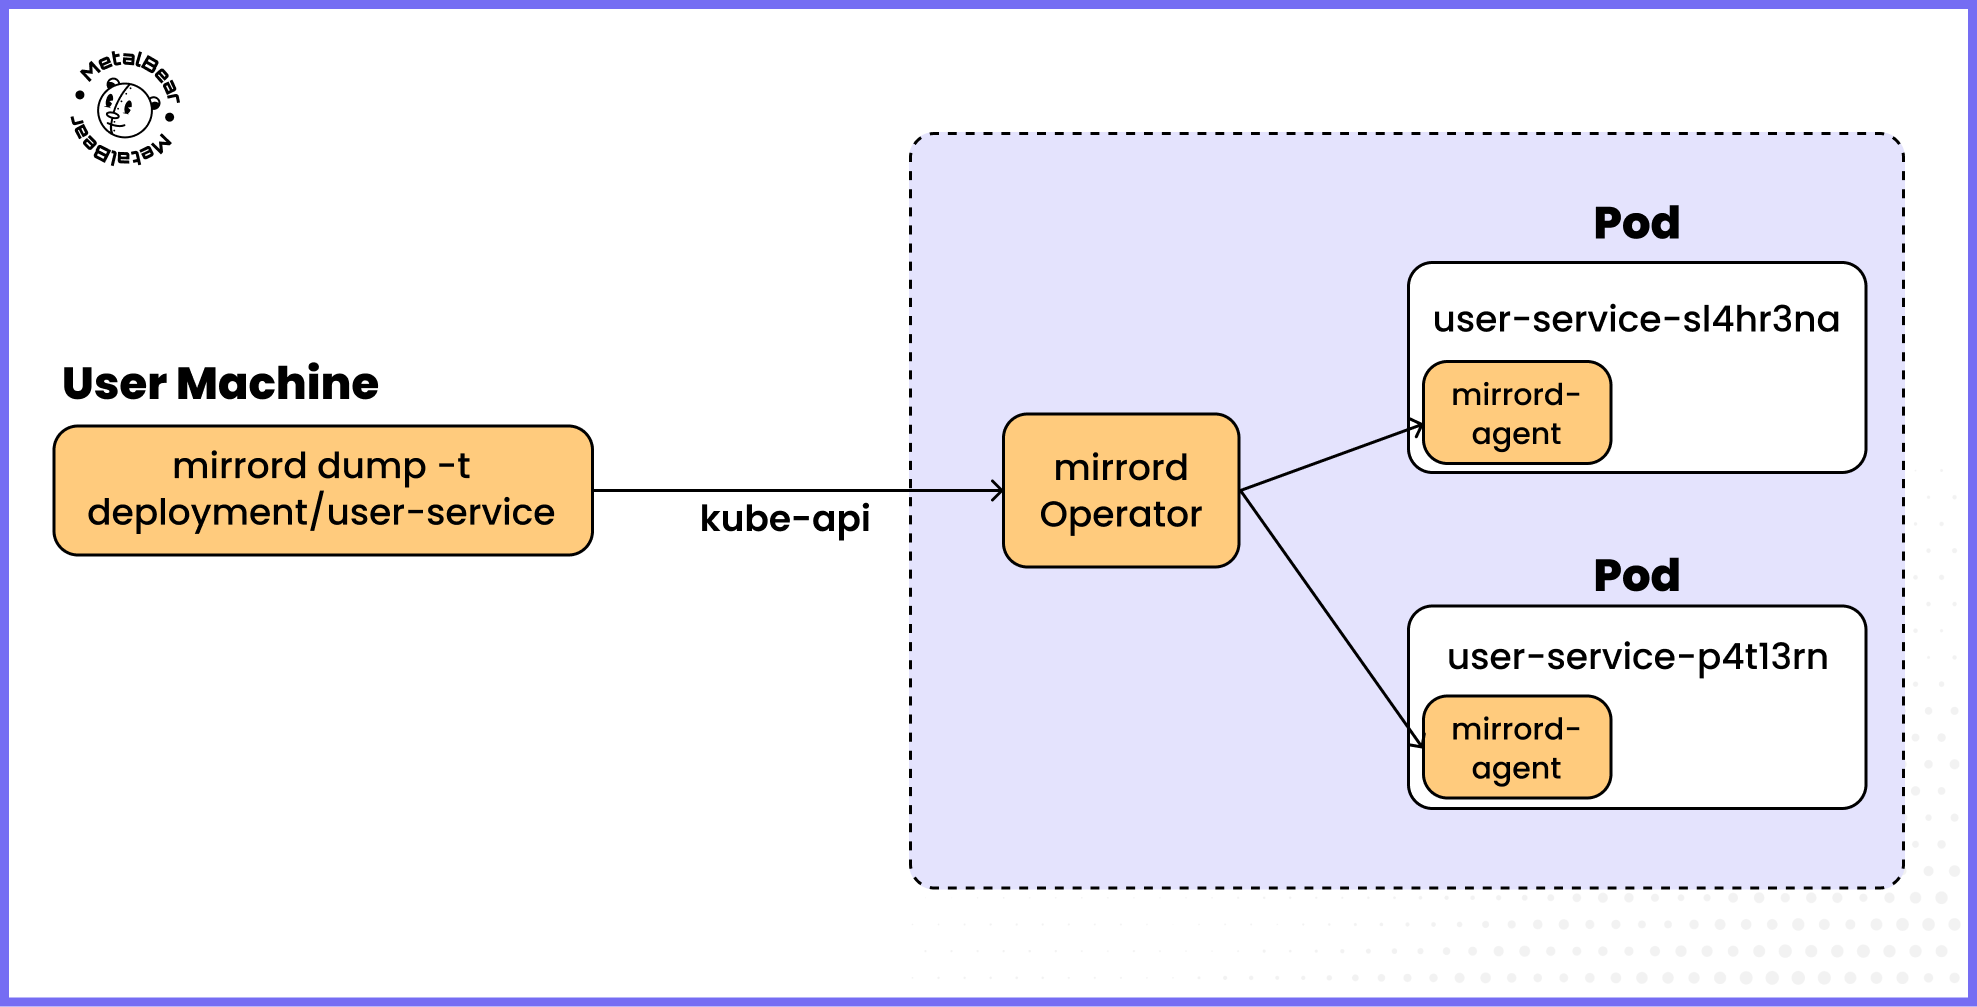
How mirrord dump works with workloads that have multiple replicas when using the mirrord operator.
How mirrord dump works with workloads that have multiple replicas (with help of the mirrord operator)
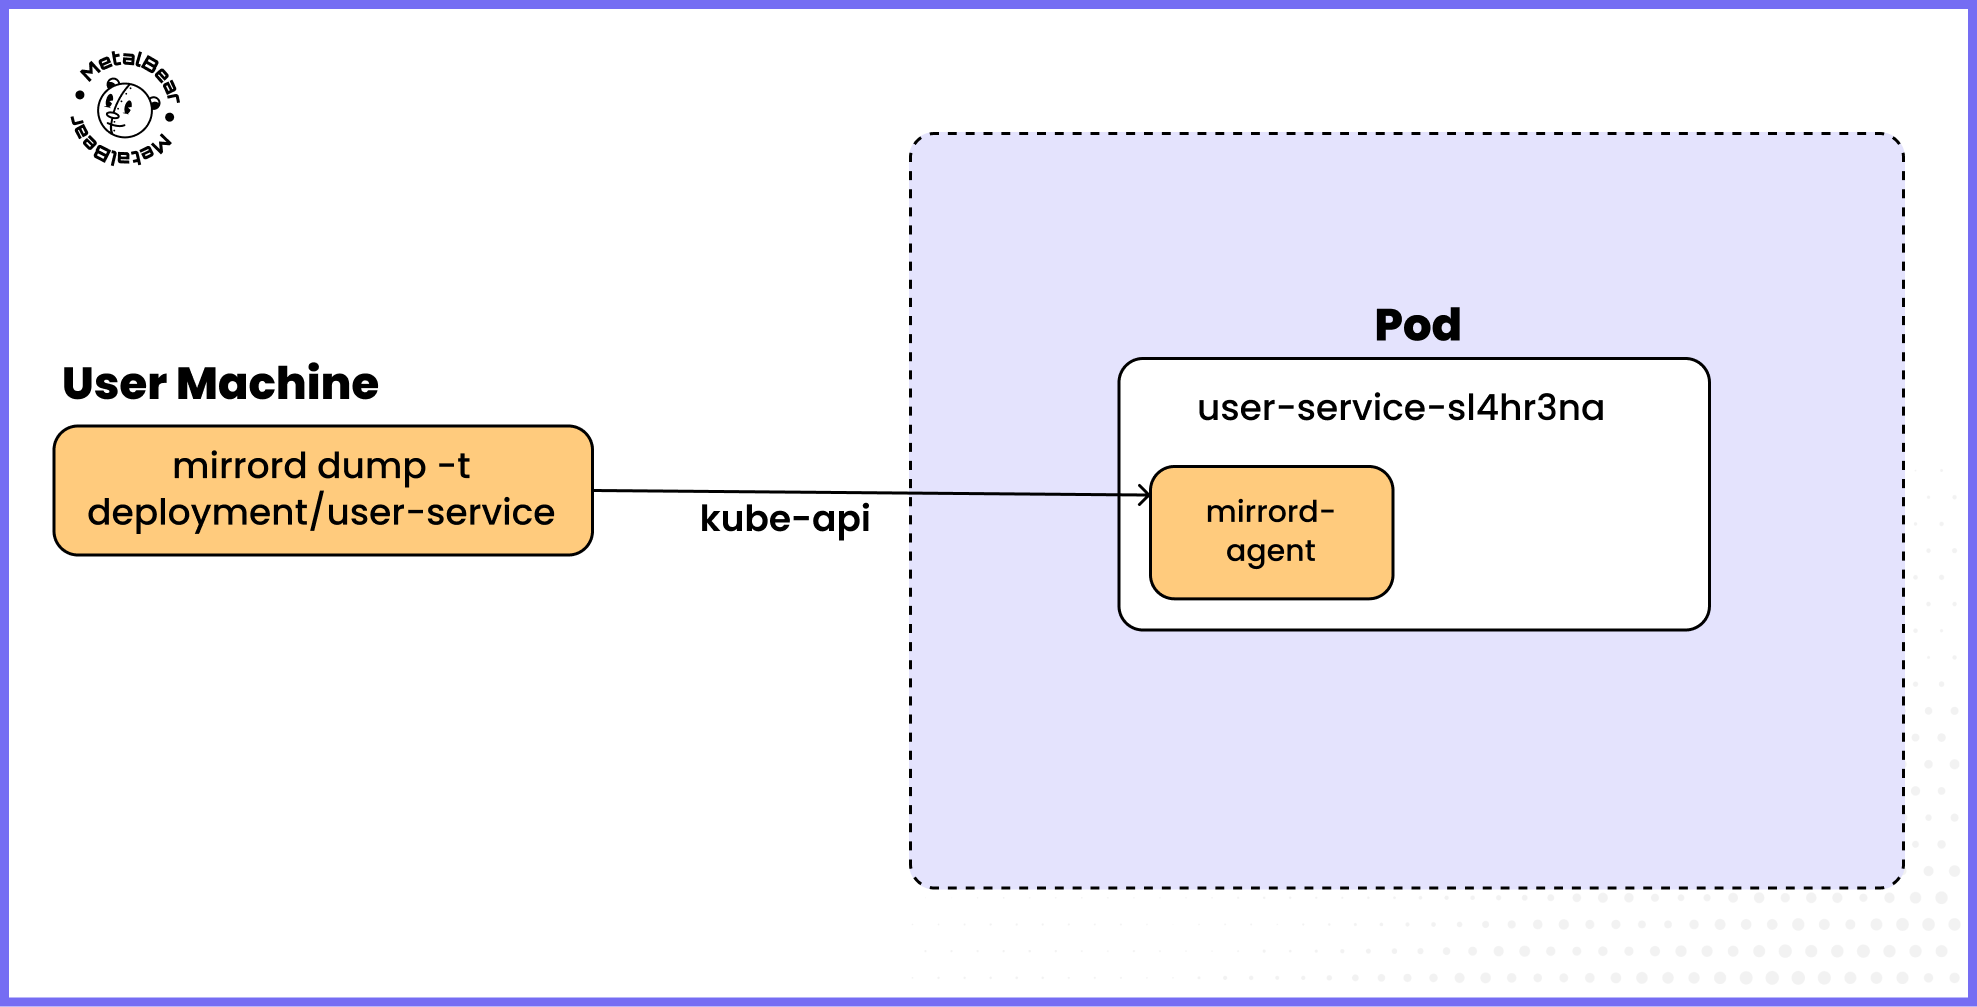
How mirrord dump works when using the OSS version.
What’s next?
A couple of things we’re already working on:
- Passthrough traffic mirroring: We’re improving how mirroring is handled inside the agent, making it more robust.
- Traffic recording: Adding an easy way to write captured traffic to file (in plain text, JSON, or some other format - let us know what formats you’d like!).
Come chat with us on Slack, and give mirrord dump a try.
It’s one of those commands you’ll forget exists, until the day you desperately need it. And then you’ll be glad it’s there :)